API Design: Unlocking the Value of your Data
In recent years the travel industry has witnessed an explosive growth in APIs (application programming interface). This reflects the rise in online portals selling travel products. These portals help end consumers make their travel plans,—enabling them to browse through rates of various travel products in real time, and make bookings using any type of device, conventional desktop or portable. Indeed smartphone technology is taking over travel bookings.
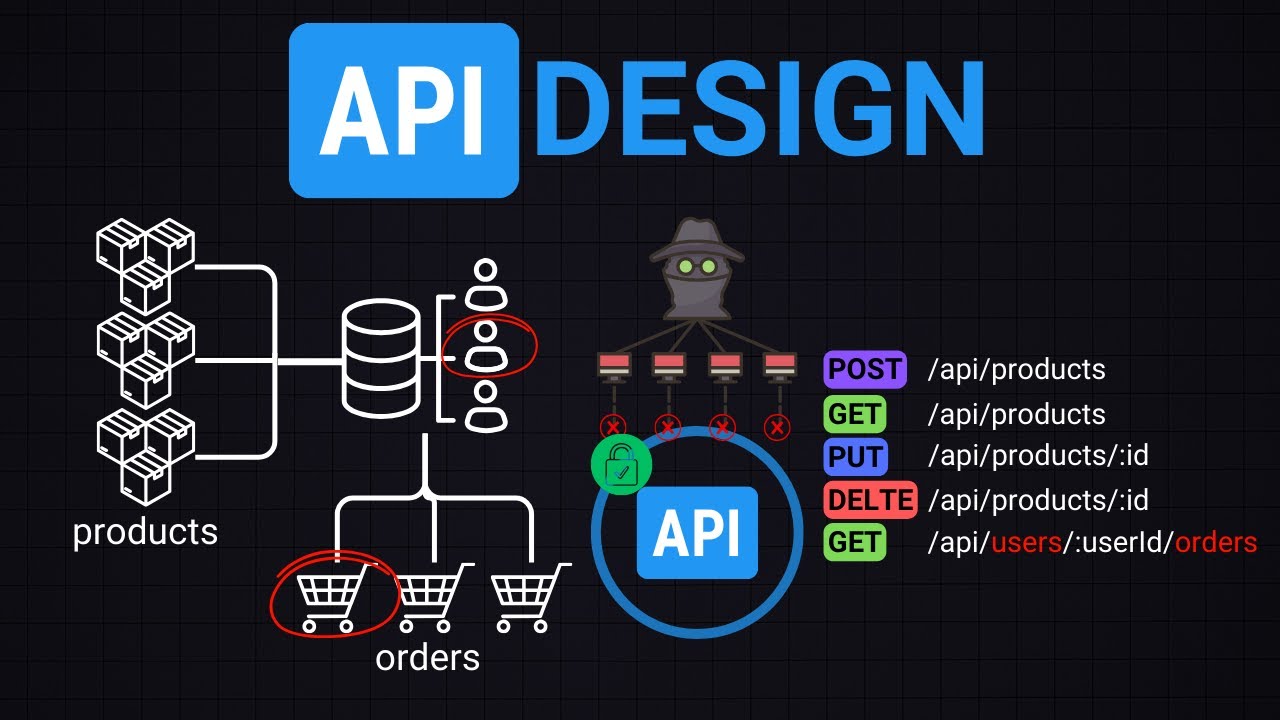
With XML or indeed JSON APIs, travel companies can integrate their online booking systems with other API travel connectors such as suppliers, aggregators and global distribution systems and get immediate access to flight, hotel and other travel product information such as prices, availability and product descriptions.
Why APIs?
These APIs facilitate third-party software programs to interact with another company’s application. The travel industry landscape is being reshaped by these APIs springing up to enable B2B and B2C companies to interconnect and share information and reach new customer channels. When travel product suppliers such as hotel companies and airlines open up data and services in a secure way via APIs, they can control who has access to their data and what they can do with it. In particular, suppliers can connect with strategic partners that can help them drive sales and ancillaries (such as bags, lounges, rooms. Cars), tours, etc).
Essentially, APIs allow online companies to innovate by allowing developers from other partner companies to access their code and adapt it for their own use. Indeed many companies have a dedicated developer portal that hosts the API, plus any tools and resources people using it might need. Aptitude Portal is a prime example. By engaging and supporting the people who want to use the API, the partner developer community will continue to innovate and grow for everyone’s benefit.
Foundation for Analysis
APIs can also provide for a more efficient and scalable development process. Given the strategic importance and revenue potential of APIs, attention needs to be paid to not only how they are designed and used but also how the information that flows through them can be analysed and applied to help drive business decisions. The data a company collects is only as valuable as the questions it can answer. For data to be meaningful it needs to be translated into valuable insights that drive action. Laying the framework to achieve this is best planned at the beginning by taking account of:
– Context: What are you trying to achieve? Who has a vested interest in the data and its analysis?
– Need: What specific needs could be addressed by intelligently using the data?
– Vision: What does the future look like? Functionality, scalability, integration?
– Outcome: How and by whom will the result be used and integrated into the company?
Deriving business intelligence from search and booking streams and transactions is an important differentiator for online travel companies. So analytics play a crucial role in ensuring the success of API programs, but getting those insights does not happen by accident. A vision of the insights that are possible from the API should already be present at the design stage. In particular the following are 3 core principles should not be forgotten, whether API, whether for travel or any other industry
– Ease of use – APIs need to be able to be easily understood and deployed by developers. This means designing them with clear uniform resource identifiers (URIs) and noncomplex data structure (either JSON or XML). Keep it simple and well documented.
– Target audience — An API should be designed with a target audience in mind, since ultimately consuming data by other systems is the ultimate objective. It is therefore important to keep both the developer and the end consumer in mind while designing the interfaces for the API.
– Technical considerations – Although XML is the preferred data structure over JSON for travel APIs, the increasing adoption of mobile apps is leading to more JSON formats being applied due to its lighter weight and flexible model. Many established APIs handling complexity are XML based while newer ones or those aimed at the mobile market are based on JSON.
Our customers are evangelisers for the use of APIs in their developer communities with the long term aim to build applications that help improve distribution of travel data—inventory, rates, and availability, among others,—and innovative products that work seamlessly and in turn enrich the travel ecosystem. By delivering them a unique analytics platform that extracts deep granular intelligence from search traffic as well as bookings, they have the insights they need to keep tabs on their own distribution performance as well as their partners.